今日のIELTS Writingの参考資料、今日の新しいお題です(^O^)!
お手本も載せているので、自分の書いたWritingの文と見比べてみて下さい。新しい単語や言い回しなども発見できて、参考になるところやWritingに必要なテクニックを是非参考にしてみて下さいね!
スキルを伸ばすにはまず毎日やり続けて、そして自分の欠点を知ることから始まります。
Let's try it to improve your English skills!!!!
Topic 18
Writing Task 1: You should spend about 20 minutes on this task.
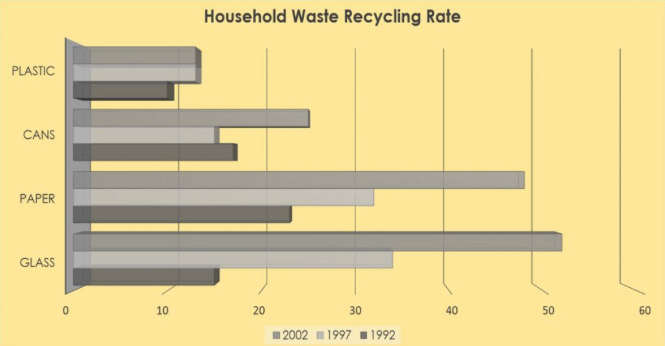
The graph below show the percentage of household waste recycled in the city between 1992 and 2002.
Summarise the information by selecting and reporting the main features, and make comparisons where relevant.
Write at least 150 words.
The graph show the percentage of different household wastes recycled during the period between 1992 and 2002.
As can be observed from the chart, in 1992, the most recycled household waste are cans (17%), followed by paper (15%0 and glass (15%), then by plastic (10%). In 1997, the trend reversed. The recycling rate for cans decreased by around 3%, whereas the rates for glass, paper, and plastic increased to 34%, 32%, and 12%, respectively.
In 2002, three things should be noted. First, the recycling rate for glass and paper further increased by large margins. More than 50% of glass wastes and 45% of paper wastes got recycled during that year. Second, the recycling rate for plastic remained stable at 12%.
To conclude, glass and paper wastes were recycled at an increasing rate. The recycling rate of cans fluctuated, and that of plastic remained fairly steady.
